Case Study, R
RStudio Text Mining Case Study: Cybersecurity News

An anonymized student project from a London university, prepared from the supplied R Markdown workflow and report.
Project type: RStudio text mining and computational media analysis Methods: Guardian API collection, text cleaning, tokenization, stemming, LDA, STM, keyword categorization, and sentiment analysis Outputs: Regional article comparisons, topic diagnostics, topic-term plots, and sentiment charts Data basis: The Guardian articles from the UK, US, and Australia, balanced at 100 articles per edition
The student arrived with an urgent RStudio request: seven coded tasks needed correction, improvement, and completion, and the accompanying short paper needed to follow a supplied template and marking criteria. The project examined regional differences in cybersecurity news. It searched The Guardian for articles containing “cybersecurity” or “cyber security,” prepared a balanced sample from three regional editions, and used text analysis to examine topics, terminology, and sentiment.
The finished work is best understood as a reproducible text-analysis workflow. It shows how a student can move from an API query to cleaned documents, token counts, topic models, and regional sentiment charts. It also shows why a technically polished report still needs careful interpretation before it is presented as evidence of media bias.
What the student needed from the RStudio project
The brief combined coding support with research writing. The student asked for the existing RStudio code to be corrected and completed according to seven commented tasks and subtasks. They also requested a short paper based on the code, with relevant references, a supplied Word template, and the marking guidance as the structure for the final submission.
The research question was specific: do UK, US, and Australian editions of The Guardian frame cybersecurity differently? The project proposed three groups of questions:
- Which cybersecurity terms appear most often in each regional edition?
- Do sentiment scores differ between the three editions?
- Can topic modeling reveal different themes in the coverage?
The original hypotheses expected stronger business and breach language in US coverage, more legal and compliance language in UK coverage, and more policy-oriented themes in Australian coverage. Those were useful hypotheses for directing the analysis. They were not treated as confirmed findings before the code produced evidence.
How the data was collected from The Guardian
The workflow used the guardianapi R package to query The Guardian Open Platform. The API documentation describes the service as a programmatic way to retrieve content, sections, editions, and individual items. The project used that structure to identify the regional editions represented by uk-news, us-news, and australia-news.
The initial collection tested seven time windows, from roughly one month through a 20-year window beginning in 2005. The main analysis used the long window ending in early 2025 and searched for the two spellings of the subject phrase. The code then retained article records and prepared fields such as publication date, headline, summary, article body, byline, word count, and URL.
The three editions did not return the same number of articles. To prevent the largest regional group from dominating the comparisons, the workflow used set.seed(123) and randomly selected 100 articles from each edition. That produced a 300-article analysis sample with equal representation from Australia, the UK, and the US.
Equal sampling made the regional charts easier to compare, but it also changed the question being answered. The results describe the selected 100-article groups, not the full publishing volume of each edition. That distinction belongs in the method section of any final paper.
How the R text-processing pipeline worked
The analysis prepared the article text in stages so later methods worked with a consistent document structure.
- HTML markup was removed from the article body.
- Text was converted to lowercase.
- Digits and punctuation were removed.
- Repeated whitespace was collapsed.
- English stopwords were removed with the
tmpackage. quantedatokenized the original and cleaned text.- The workflow created token counts and a stemmed token field for later analysis.
The code labels the final step as lemmatization in places, but the implementation uses tokens_wordstem(). Stemming and lemmatization are related but different operations. Naming the operation correctly makes the report easier to reproduce and keeps the methods section technically accurate.
What the exploratory figures established
The project report contained several genuine outputs from the R workflow. Four figures are included below because they are readable and directly connected to the methods. A separate regional term-frequency visual from the supplied report was too dense to interpret responsibly, so it is not presented as evidence here.
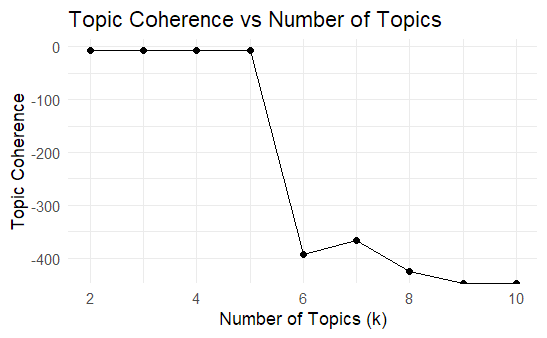 Figure 1. Model-selection diagnostic used to choose the number of LDA topics.
The first diagnostic compares candidate topic counts from 2 through 10. The supplied code selected the highest value from a simplified mean(log(beta)) calculation, and the report used a two-topic solution. That calculation is a project-specific diagnostic, not a standard topic-coherence measure such as a held-out likelihood, semantic coherence, or exclusivity score. The chart is therefore useful as a record of the workflow, while its label should remain cautious in a formal paper.
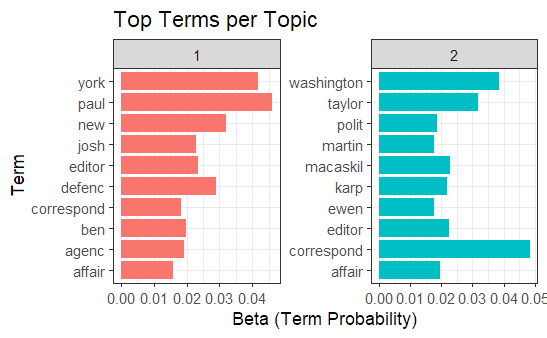 Figure 2. Highest-probability terms returned by the selected two-topic LDA model.
The topic output is a good example of why topic models require human review. Several high-probability terms in the supplied figure are names or general words, including “york,” “paul,” “new,” and “washington.” They do not form a clear cybersecurity theme on their own. A stronger next pass would remove names and other corpus-specific noise, add domain stopwords, and rerun the model before making claims about regional themes.
How the sentiment analysis compared regions
The workflow used sentimentr to assign an article-level sentiment score after cleaning the body text. It then summarized the scores by regional edition and visualized both the overall distribution and regional averages.
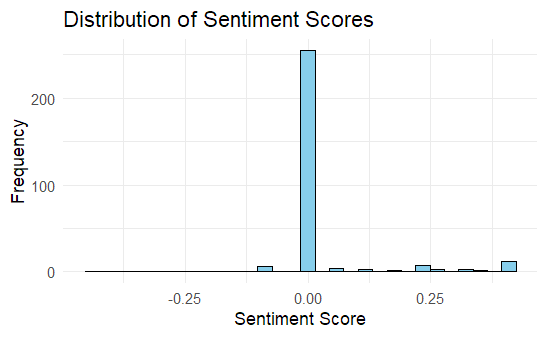 Figure 3. Distribution of article-level sentiment scores after text cleaning.
Most observations in the supplied distribution sit close to zero, with a smaller group of positive scores and a thinner negative tail. That shape means the regional comparison should not be reduced to a simple statement that one edition is “positive” or “negative.” The size and shape of the distribution matter as much as the mean.
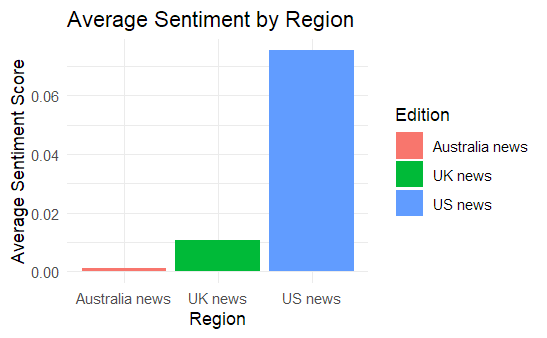 Figure 4. Average sentiment score by Guardian regional edition.
The regional chart places the US edition highest, the UK edition in the middle, and the Australian edition close to zero. This pattern is consistent with the original hypothesis about different tones, but the figure alone does not prove regional bias. It describes the output of one sentiment lexicon applied to one publisher’s articles and one balanced sample.
What makes the project useful for students
This project teaches several practical lessons that apply to RStudio data science assignments.
- Start with a research question before choosing a package or chart.
- Keep the API query, date window, edition filter, and sample size visible in the report.
- Use a fixed random seed when balancing groups so another reader can reproduce the sample selection.
- Separate exploratory outputs from final evidence. A chart can run successfully and still need interpretation.
- Name the exact preprocessing operation. Stemming is not the same as lemmatization.
- Explain what a sentiment score measures, and avoid treating it as a direct measure of truth, bias, or reader impact.
- Include the sample size beside regional averages so readers can judge the comparison.
For students who need help understanding a similar workflow, R Studio tutoring is the most direct subject match. Students working across statistical analysis and coding can also explore statistics homework help, while Python-based versions of the same text-mining pipeline fit Python assignment help. Broader programming support is available through the GeeksProgramming homepage.
Important note about the dataset and results
The article set came from The Guardian API, not from a survey of all news publishers. The edition field acts as a regional proxy, and equal sampling reduces the original difference in article volume. The keyword query can also miss articles that discuss cybersecurity without using either search phrase.
The report’s topic-model output needs a second validation pass before it supports strong claims about regional themes. The supplied coherence calculation is simplified, and the highest-probability terms include several names and general words. The semantic-analysis section also creates the object called bigram_dfm from ordinary tokens, so it should not be described as a verified bigram analysis without correcting that code.
These are normal issues in an exploratory student project. Recording them makes the case study more useful because it shows where an RStudio workflow ends and research judgment begins. The published version does not reveal the student’s name, university, or API credentials.
Questions students ask about this RStudio project
Was this a machine-learning project?
The completed workflow is primarily a text-mining project. It uses tokenization, stemming, document-feature matrices, LDA, STM, keyword categorization, and sentiment analysis. Predictive classification code appears in the R Markdown file as commented future work, so this case study does not present classifier accuracy as a completed result.
Why were exactly 100 articles used from each region?
The code sampled 100 articles per edition with a fixed seed. Equal groups prevent the largest edition from controlling a simple comparison, but the result represents the balanced sample rather than the full article counts.
Can the results prove that one region is biased?
No. The results identify differences in the selected text and sentiment scores. A stronger bias claim would require multiple publishers, a documented coding scheme, validated sentiment and topic measures, and statistical uncertainty around the comparisons.
Why keep the imperfect topic chart in the case study?
The chart is included as a record of the supplied model output, not as proof that the topics are meaningful. It shows students why topic modeling needs domain stopwords, interpretation, and validation before the labels become findings.
Sources and project context
The data source was The Guardian Open Platform documentation. The supplied paper also cites Blei, Ng, and Jordan’s work on Latent Dirichlet Allocation, McCombs and Shaw’s agenda-setting research, Entman’s framing work, and foundational writing on public opinion and media influence.
This case study is based on an anonymized urgent student request, the supplied R Markdown solution, and the accompanying Word report. It describes the work as an educational project record. It does not claim that the analysis represents every Guardian article, every regional newsroom, or a new experimental dataset.