Python
Matplotlib in Python: Plots and Charts
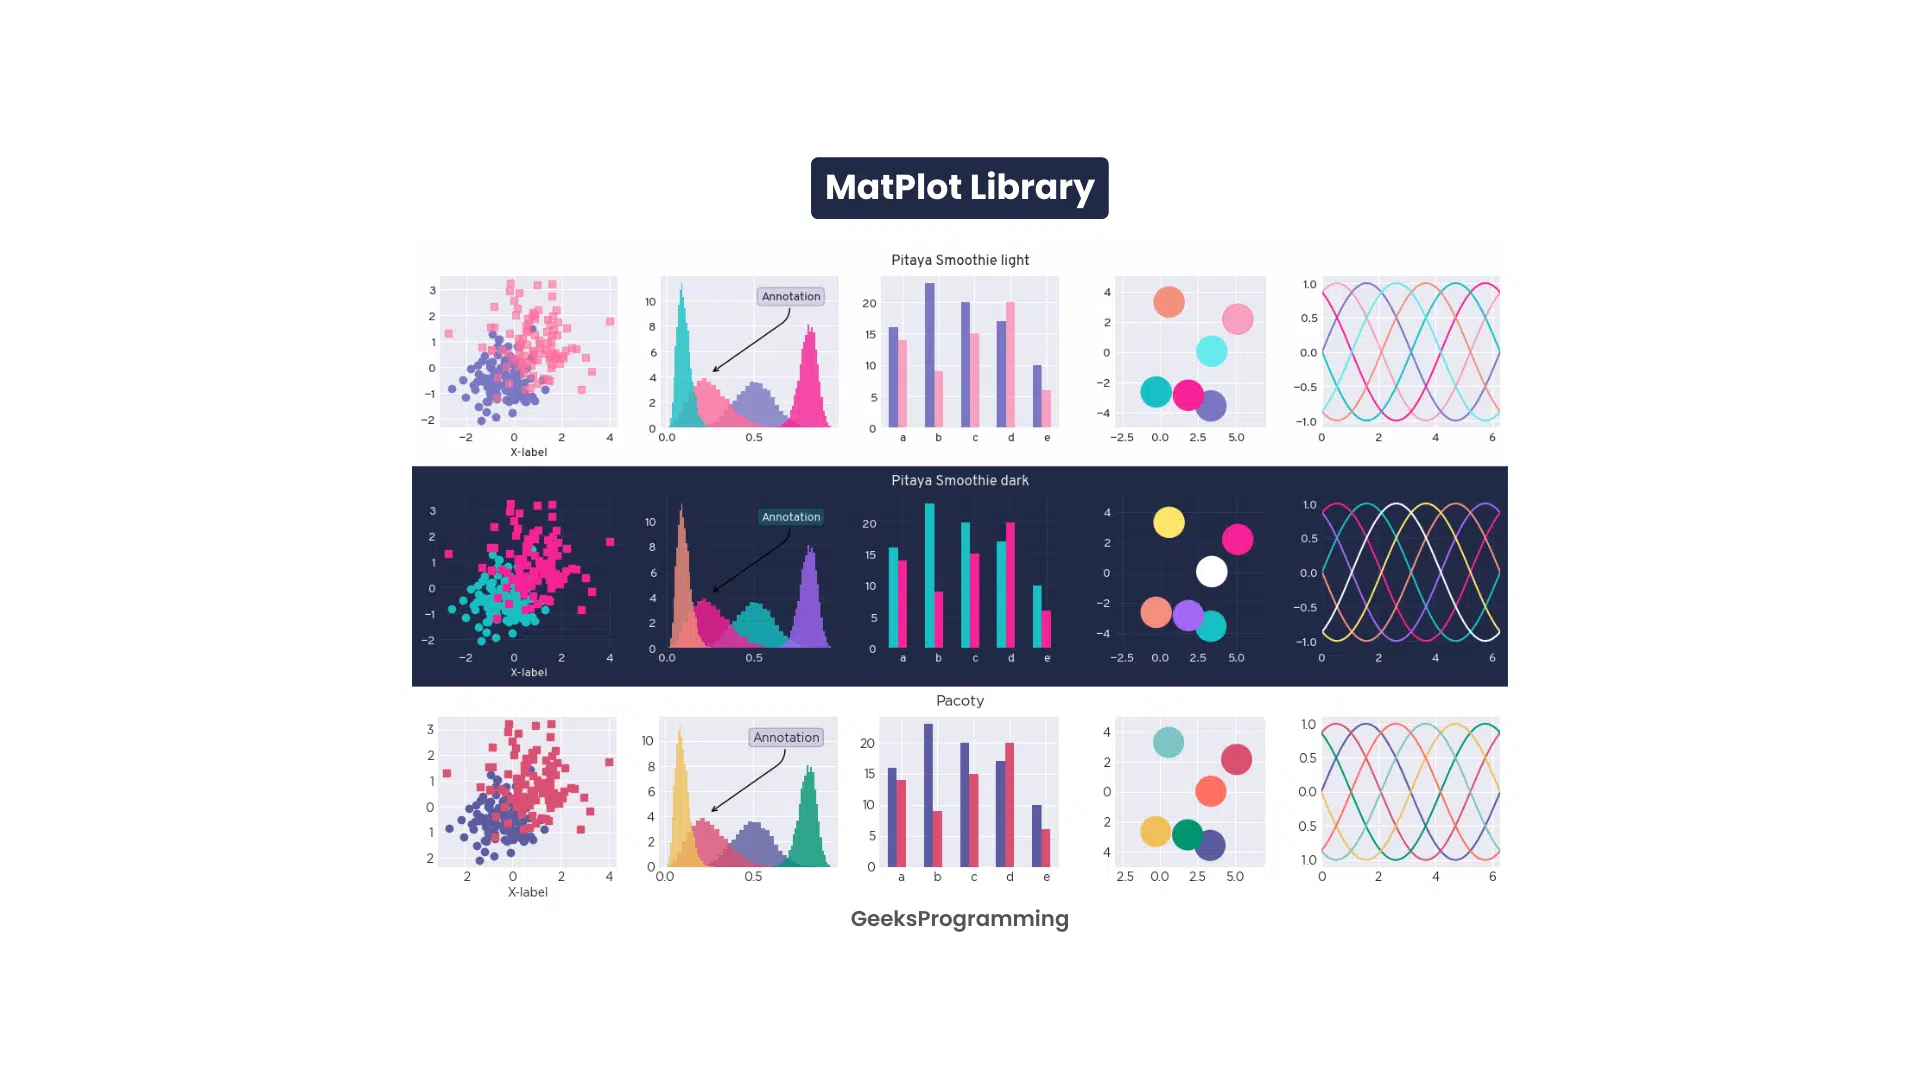
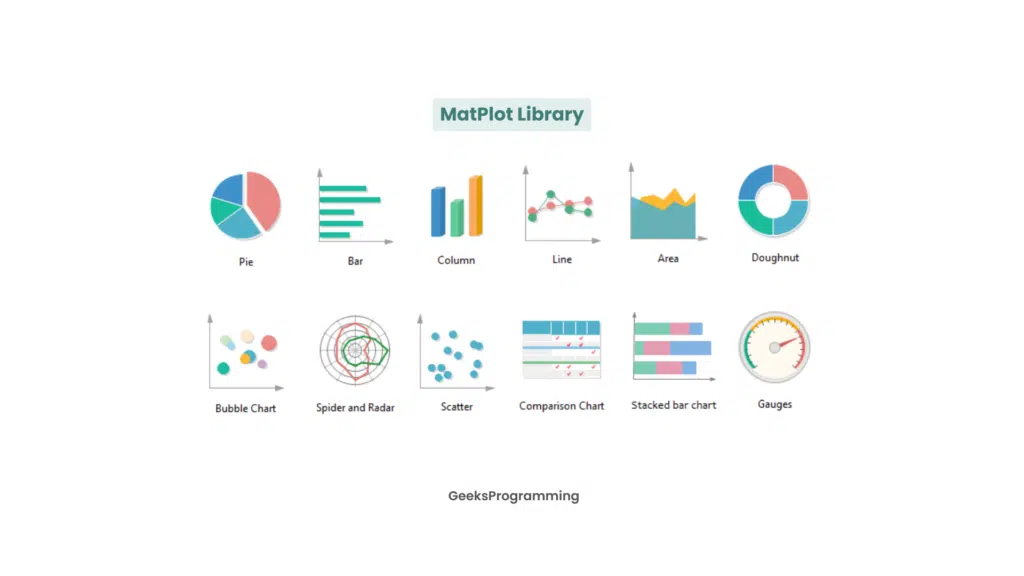
Matplotlib is Python’s most widely used plotting library. It ships a complete API for creating line plots, histograms, scatter plots, bar charts, and pie charts. This guide walks through installation, core plot types, and a randomized chart activity so you can see the library working end to end.
What Matplotlib Does
Matplotlib provides a pyplot module that mimics MATLAB’s plotting interface. You can build stable, animated, or publication-ready figures from within Python scripts, Jupyter notebooks, and web application servers. The library is open source, actively maintained, and supports every major operating system.
Installing Matplotlib
Install via pip or conda on Windows, macOS, or Linux.
Windows:
Check that Python and pip are present:
python --version
pip -V
Install Matplotlib:
pip install matplotlibConfirm the install:
import matplotlib
print(matplotlib.__version__)
macOS:
Check for Python 3 and pip3:
python3 --version
pip3 --version
Install:
pip3 install matplotlibCreating Simple Line Plots with Pyplot
matplotlib.pyplot is the state-based interface to Matplotlib. Import it once and use it through your script.
Step 1: Import the library
import matplotlib.pyplot as graphStep 2: Define x and y data
X = [1, 2, 3, 4, 5]
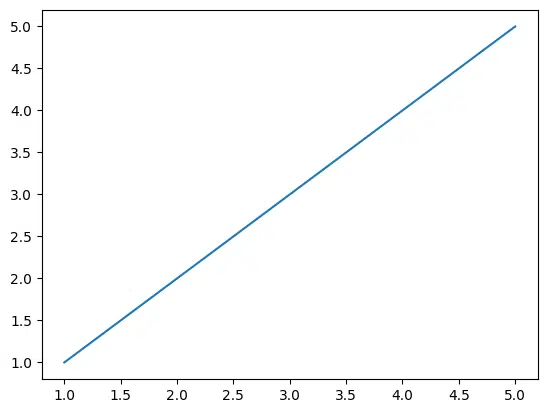
Y = [1, 2, 3, 4, 5]Step 3: Plot the data
graph.plot(X, Y)When you pass only Y values, Matplotlib generates x coordinates starting at 0 up to len(Y) - 1:
graph.plot(Y)Step 4: Display the figure
graph.show()Output:
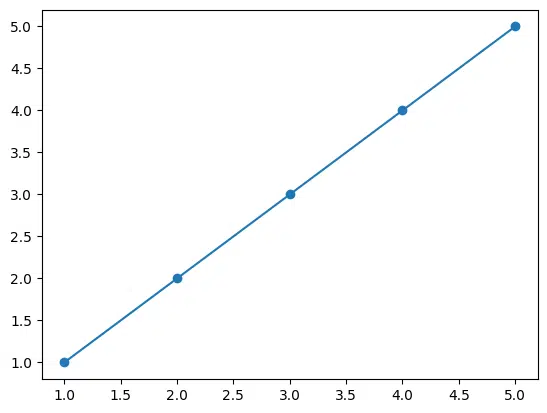
Markers
Markers highlight individual (x, y) points on a plot. Pass a marker character as an extra argument to plot().
Common marker characters:
| Marker | Shape |
|---|---|
. | Dot |
o | Circle |
* | Star |
^ | Triangle |
| | Vertical line |
x | Cross |
graph.plot(X, Y, marker='o')Output:
Line Styles
Line style combines with the marker in a single format string. The first character is the marker; the second is the line style.
Examples:
"o-"means circle marker, solid line"*:"means star marker, dotted line
| Character | Line style |
|---|---|
- | Solid |
-- | Dashed |
: | Dotted |
-. | Dash-dot |
Leave the style character empty to display only markers and no connecting line.
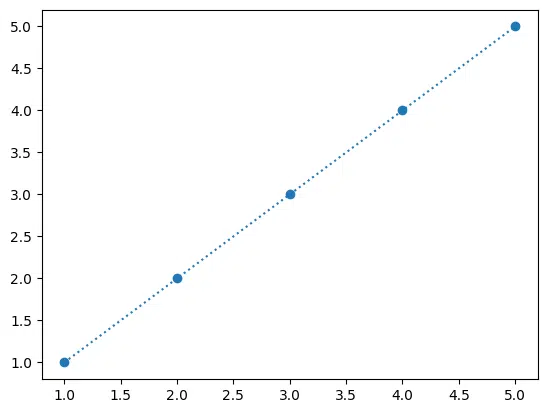
graph.plot(X, Y, 'o:')Output:
Line Colors
Append a color code to the format string after the marker and line style: "<marker><line-style><color>".
The color character is optional.
| Code | Color |
|---|---|
r | Red |
g | Green |
b | Blue |
w | White |
k | Black |
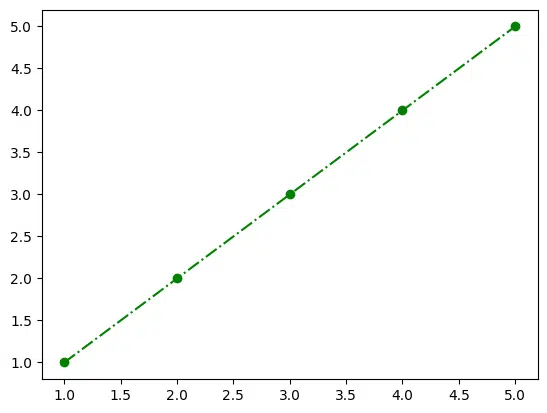
graph.plot(X, Y, 'o-.g')Output:
Marker Border Colors
The marker edge color is set separately from the line color using the mec (or markeredgecolor) parameter. It accepts the same single-letter color codes.
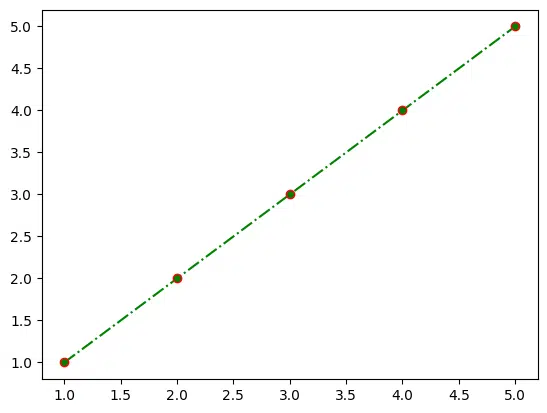
graph.plot(X, Y, "o-.g", mec='r')Output:
Marker Size
Control marker size with the ms (or markersize) parameter. The default is 6 points.
graph.plot(X, Y, "o-.g", mec='r', ms=10)Output:
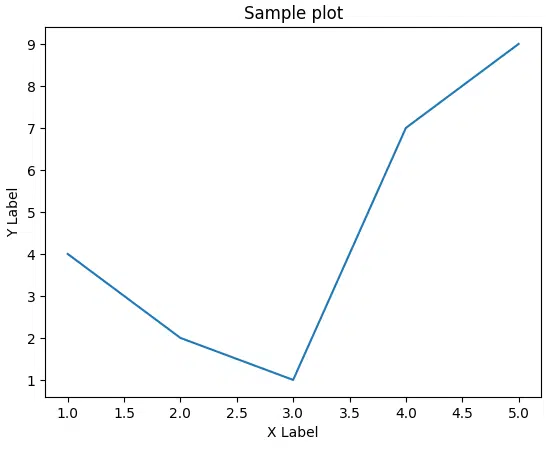
Axis Labels and Title
Use xlabel(), ylabel(), and title() to annotate a figure.
import matplotlib.pyplot as graph

X = [1, 2, 3, 4, 5]
Y = [4, 2, 1, 7, 9]

graph.plot(X, Y)
graph.title("Sample plot")
graph.xlabel("X Label")
graph.ylabel("Y Label")
graph.show()
Output:
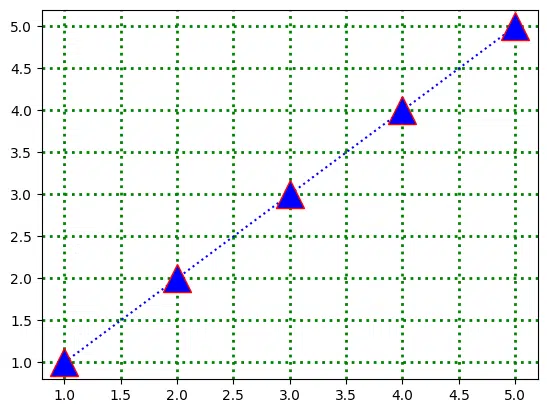
Grid Lines
The grid() function overlays reference lines, which makes reading data values easier.
import matplotlib.pyplot as graph
X = [1, 2, 3, 4, 5]
Y = [1, 2, 3, 4, 5]
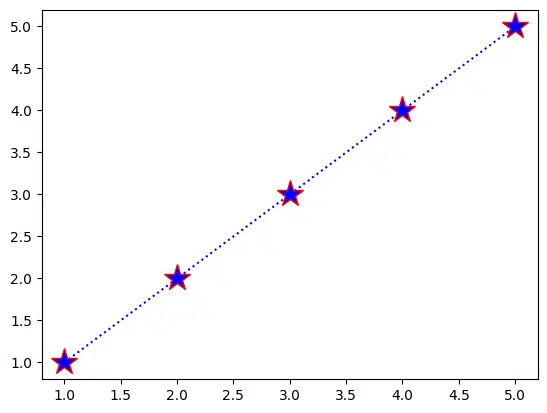
graph.plot(X, Y, "*:b", mec='r', ms=20)
graph.grid()
graph.show()Output:

Restrict the grid to one axis:
graph.grid(axis='y')Customize grid appearance with color, linestyle, and linewidth:
graph.grid(color='g', linestyle=':', linewidth=1.8)Output:
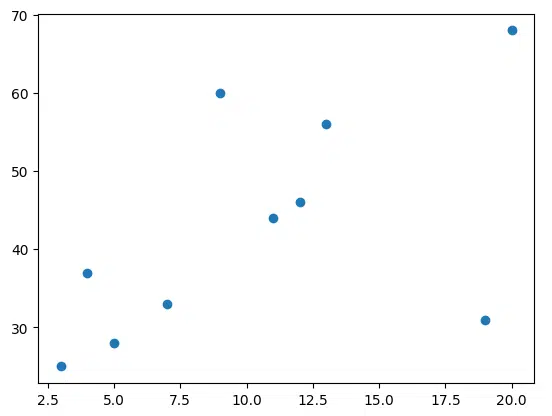
Scatter Plots
scatter() plots one dot per (x, y) pair. It takes two equal-length arrays.
import matplotlib.pyplot as graph

X = [3, 7, 12, 19, 5, 11, 9, 4, 13, 20]
Y = [25, 33, 46, 31, 28, 44, 60, 37, 56, 68]

graph.scatter(X, Y)
graph.show()
Output:
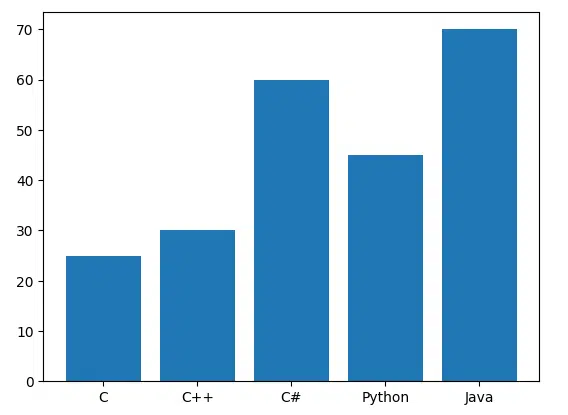
Bar Charts
bar() draws a vertical bar for each x value.
import matplotlib.pyplot as graph

X = ["Python", "Java", "C++", "JavaScript", "C"]
Y = [40, 30, 15, 10, 5]

graph.bar(X, Y)
graph.show()
Output:
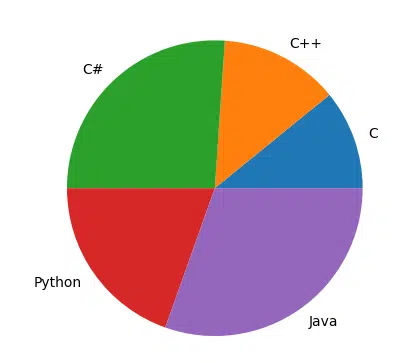
Pie Charts
pie() draws a circular chart. Add labels to identify each slice. Matplotlib assigns colors automatically.
import matplotlib.pyplot as graph

X = [25, 30, 60, 45, 70]
Y = ["C", "C++", "C#", "Python", "Java"]

graph.pie(X, labels=Y)
graph.show()
Output:
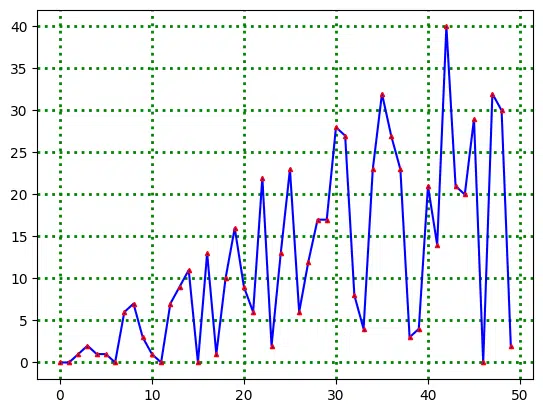
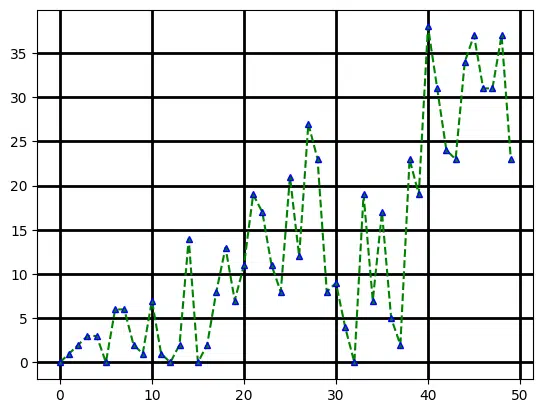
Fun Activity: Randomized Chart Generator
This activity combines markers, line styles, colors, and grids using random choices. The output changes every run.
Step 1: The random selection helper
import random

list_of_items = ['A', 'B', 'C', 'D']
random.choice(list_of_items)
Step 2: Import libraries
import matplotlib.pyplot as graph
import random
Step 3: Define customization options
colors = ['r', 'g', 'b', 'w', 'k']
markers = ['*', '^', 'o']
line_styles = ['-', ':', '--', '-.']
Step 4: Generate random data
X = []
Y = []
for x in range(50):
    X.append(x)
    Y.append(random.randint(0, x))
Step 5: Build a random format string
marker_arg = ''
marker_arg += random.choice(markers)
marker_arg += random.choice(line_styles)
marker_arg += random.choice(colors)
Step 6: Random edge color and marker size
marker_edge_color = random.choice(colors)
marker_size = random.randint(1, 5)
Step 7: Random grid settings
grid_line_style = random.choice(line_styles)
grid_line_width = random.randint(1, 5)
grid_color = random.choice(colors)
Step 8: Plot with random styling
graph.plot(X, Y, marker_arg, mec=marker_edge_color, ms=marker_size)
graph.grid(color=grid_color, linestyle=grid_line_style, linewidth=grid_line_width)
Step 9: Show the result
graph.show()Re-run the script and the output changes each time. Two sample outputs are below.
Sample Output 1:
Sample Output 2:
Need Help with a Python Assignment?
If you are working on a data visualization assignment that uses Matplotlib, NumPy, or pandas, Python assignment help from GeeksProgramming connects you with developers who write to your exact library versions. Pay 50% upfront and 50% after you verify the code runs on your data.
For assignments that involve machine learning plots or model evaluation charts, see machine learning assignment help.
Related reading: Introduction to Machine Learning with Python and Introduction to Programming in Python.
Related articles
-
 Machine Learning
Build a Movie Recommendation System in Python
Build a movie recommender in Python with content-based filtering, collaborative filtering, and a hybrid model, then evaluate it and ship it with Flask.
Jan 27, 2025
-
 Programming
How to Become a Python Developer
A step-by-step roadmap covering core Python concepts, libraries, frameworks, databases, testing, DevOps, and interview prep for aspiring Python developers.
Oct 26, 2024
-
 Python
Efficient Python Algorithms Explained
Sorting, searching, dynamic programming, greedy methods, and string algorithms in Python, with Big O analysis and working code for each.
Mar 22, 2024