Machine Learning
Machine Learning with Python: A Guide

Machine learning lets computers learn patterns from data without requiring explicit rules for every decision. Its applications span healthcare diagnostics, financial fraud detection, content recommendation, and computer vision. The approach differs from classical programming: instead of writing fixed rules, you feed labeled examples to an algorithm and it infers the rules itself.
Four concepts anchor every ML project: training data (the examples the model learns from), features (the measurable attributes of each example), labels (the outcomes you want to predict), and models (the mathematical functions the algorithm builds from training data). Working through supervised learning, unsupervised learning, and deep learning gives you a practical foundation for real assignment work.
Supervised Learning Algorithms
Linear Regression
Linear regression predicts continuous outcomes by fitting a straight line through training data. The line is defined by an intercept (b) and slope (m), estimated via least-squares minimization: the algorithm finds the line that minimizes the sum of squared differences between observed and predicted values.
The method rests on three assumptions: the relationship between features and target is linear; errors are independent and have constant variance (homoscedasticity); and residuals are normally distributed. When these hold, the coefficients are interpretable directly.
Consider predicting house prices from square footage and bedroom count. If the fitted coefficient for square footage is 100, each additional square foot adds $100 to the predicted price on average. A coefficient of 50 for bedrooms adds $50 per bedroom. Linear regression surfaces these magnitudes in a way tree-based models do not.
Support Vector Machines
Support Vector Machine (SVM) finds the hyperplane that best separates two classes by maximizing the margin between the hyperplane and the nearest data point from each class. A wider margin signals better generalization to unseen data.
For handwritten digit classification on MNIST, each 28x28 image becomes a 784-dimensional feature vector. SVM learns the optimal hyperplane parameters by solving a constrained optimization problem, typically using quadratic programming. Once trained, classifying a new digit means checking which side of the hyperplane it falls on. SVM handles noisy or overlapping data well because margin maximization penalizes misclassifications globally, not just locally.
Decision Trees
Decision trees split feature space by selecting the attribute that reduces impurity the most at each step. Two common impurity measures are information gain (based on entropy) and Gini impurity. The algorithm partitions data recursively until it hits a stopping criterion: maximum depth, minimum samples per node, or pure leaf nodes.
A customer churn model for a telecom dataset illustrates this well. The tree might first split on monthly charges (above or below a threshold), then on call duration, then on tenure. Each branch narrows the population. The resulting tree is interpretable: follow the path of conditions from root to leaf and you see exactly why the model predicted churn for a given customer. Feature importance scores come naturally from how often and how effectively each feature was used to split.
Unsupervised Learning Algorithms
Clustering
Clustering groups data points by similarity without using labels. The two most common algorithms are K-means and hierarchical clustering.
K-means assigns each point to one of K clusters by iterating: assign every point to the nearest centroid, then recompute centroids as the mean of their assigned points. It minimizes within-cluster variance. Hierarchical clustering builds a tree of merges or splits, choosing pairs of clusters to combine (or divide) based on a distance metric such as Euclidean or Manhattan distance.
A retailer segmenting customers by purchase behavior illustrates both. Customers who buy electronics frequently form one cluster; those who buy apparel form another. Marketing teams then target each group with relevant campaigns rather than blasting the same message to everyone.
Dimensionality Reduction
High-dimensional data is hard to visualize and can hurt model performance through the curse of dimensionality. Dimensionality reduction compresses features into a lower-dimensional space while preserving the data’s structure.
Principal Component Analysis (PCA) identifies orthogonal directions (principal components) that capture the most variance in the data. It computes the eigenvectors and eigenvalues of the covariance matrix, then projects data onto the top k eigenvectors. t-SNE (t-distributed Stochastic Neighbor Embedding) preserves local structure instead of global variance: it models pairwise similarities in the original space and minimizes their Kullback-Leibler divergence from similarities in the 2D embedding via gradient descent.
Projecting MNIST digits from 784 dimensions to 2 dimensions with PCA or t-SNE produces a scatterplot where digits cluster visually. t-SNE tends to produce tighter, more separated clusters than PCA for non-linear data.
Deep Learning
Convolutional Neural Networks
Convolutional Neural Networks (CNNs) process image data through a hierarchy of learned filters. Three layer types make up a typical CNN.
Convolutional layers slide small learnable filters across the input image and compute dot products at each position, producing feature maps that detect edges, textures, or shapes at increasing levels of abstraction. Pooling layers (usually max pooling) downsample each feature map by retaining only the maximum value within each small region, cutting spatial size while preserving the strongest activations. Fully connected layers at the end of the network flatten the feature maps and pass them through standard dense layers to produce class probabilities.
For image classification on CIFAR-10 (60,000 color images across 10 classes: airplane, automobile, bird, cat, deer, dog, frog, horse, ship, truck), a CNN trained with a ReLU activation after each convolution and cross-entropy loss at the output layer regularly exceeds 90% accuracy. Each convolution is a learned filter applied across spatial positions, followed by an activation function such as ReLU (Rectified Linear Unit).
Recurrent Neural Networks
Recurrent Neural Networks (RNNs) process sequential data by maintaining a hidden state across time steps. Unlike feedforward networks, each neuron feeds its output back into itself at the next time step, creating memory of prior inputs.
The hidden state update at time step t follows:
ht = f(Whh * ht-1 + Wxh * xt + bh)
Where ht is the hidden state at step t, f is the activation function (tanh or ReLU), Whh and Wxh are learned weight matrices for recurrent and input connections, bh is the bias, and xt is the input at step t.
Sentiment analysis shows this in practice. Given the sentence “The course load was heavy but the labs were excellent”, an RNN reads each word sequentially, updating its hidden state with context from all prior words. By the final word, the network’s state reflects the mixed positive-negative signal and can classify the overall sentiment correctly. Long short-term memory (LSTM) and gated recurrent units (GRU) extend the basic RNN to handle longer sequences without vanishing gradient problems.
Hands-On Examples with scikit-learn
The steps below walk through data preprocessing, model training, evaluation, and inference using scikit-learn.
Step 1: Data Preprocessing
Raw data rarely arrives ready to train on. This pipeline handles missing values, scales numeric features, and one-hot encodes categoricals:
from sklearn.impute import SimpleImputer
from sklearn.preprocessing import StandardScaler, OneHotEncoder
from sklearn.compose import ColumnTransformer
from sklearn.pipeline import Pipeline

numeric_transformer = Pipeline(steps=[
    ('imputer', SimpleImputer(strategy='median')),
    ('scaler', StandardScaler())
])

categorical_transformer = Pipeline(steps=[
    ('imputer', SimpleImputer(strategy='constant', fill_value='missing')),
    ('onehot', OneHotEncoder(handle_unknown='ignore'))
])

preprocessor = ColumnTransformer(
    transformers=[
        ('num', numeric_transformer, numeric_features),
        ('cat', categorical_transformer, categorical_features)
    ]
)

X_train_processed = preprocessor.fit_transform(X_train)
X_test_processed = preprocessor.transform(X_test)
Step 2: Model Training
Fit a linear regression model on the preprocessed training data:
from sklearn.linear_model import LinearRegression

model = LinearRegression()
model.fit(X_train_processed, y_train)
Step 3: Evaluation
Measure performance on the held-out test set using mean squared error:
from sklearn.metrics import mean_squared_error

predictions = model.predict(X_test_processed)
mse = mean_squared_error(y_test, predictions)
print("Mean Squared Error:", mse)
Step 4: Inference on New Data
Apply the same preprocessing pipeline before predicting on new observations:
new_data_processed = preprocessor.transform(new_data)
new_predictions = model.predict(new_data_processed)
The key discipline here: always call transform (not fit_transform) on test and new data. Fitting on test data leaks information from the test set into the preprocessing statistics and inflates reported accuracy.
Get Help with Machine Learning Assignments
Machine learning assignments range from implementing gradient descent from scratch to debugging tensor shape mismatches in PyTorch. When you are stuck, Machine Learning Assignment Help connects you with developers who specialize in scikit-learn, TensorFlow, and PyTorch projects. Pay 50% upfront and 50% after the code runs on your data.
For broader Python work, Python Assignment Help covers data preprocessing, NumPy operations, and full-stack Python projects.
Related reading: Machine Learning Assignment Help covers the theoretical foundations behind the algorithms above. How to Use the Matplotlib Library in Python shows how to visualize training curves and feature distributions, a standard part of any ML workflow.
Related articles
-
 Machine Learning
Build a Movie Recommendation System in Python
Build a movie recommender in Python with content-based filtering, collaborative filtering, and a hybrid model, then evaluate it and ship it with Flask.
Jan 27, 2025
-
 Java
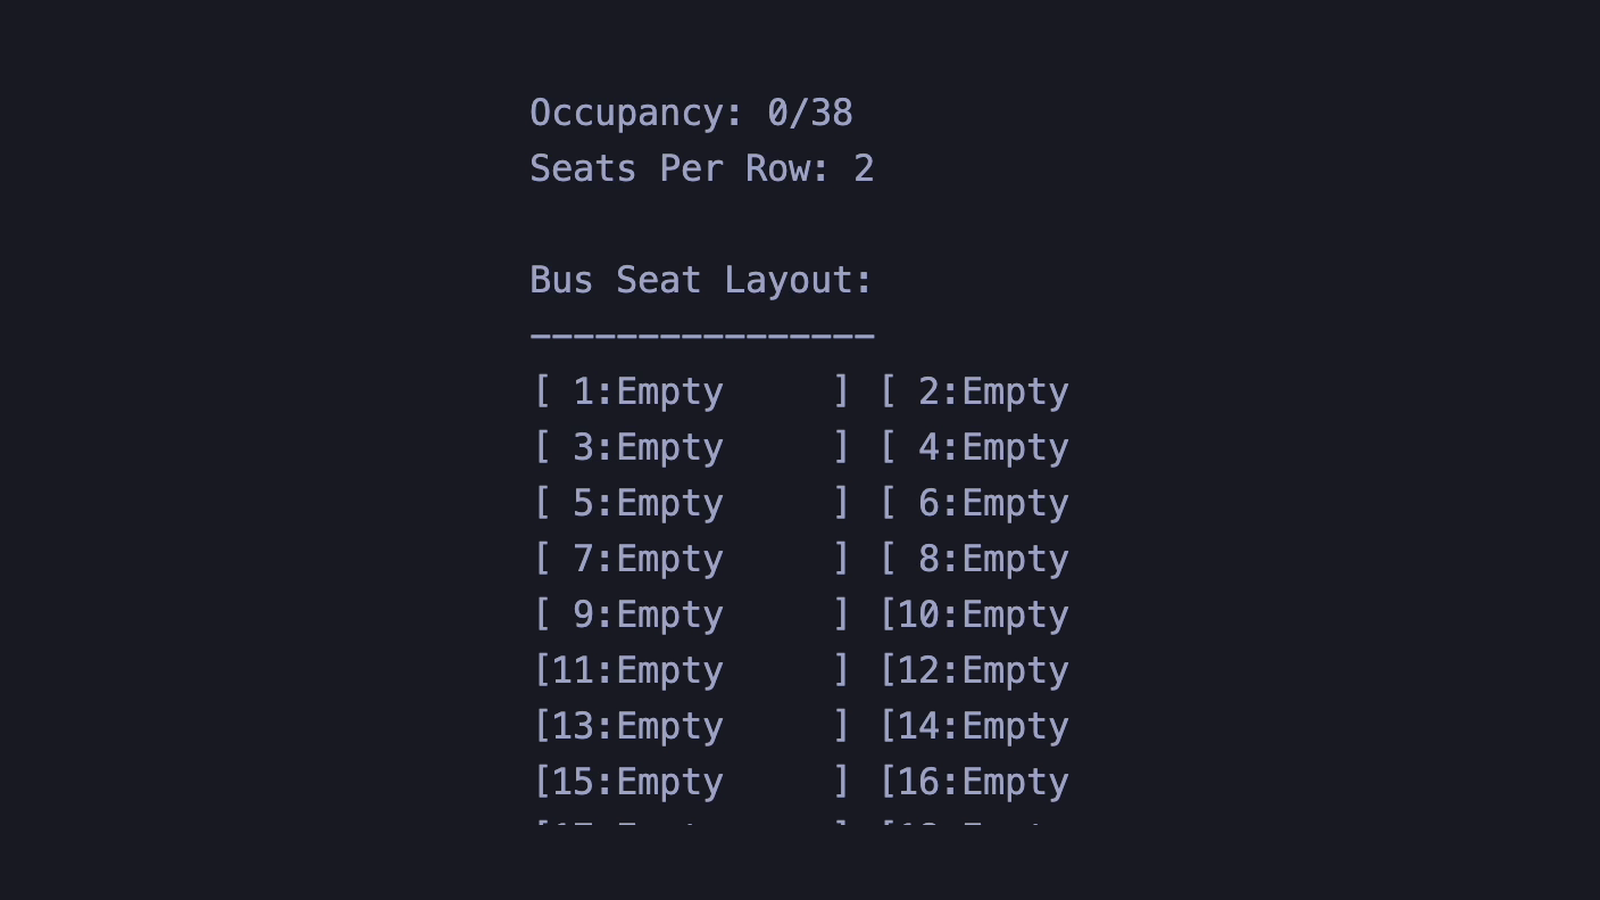
JavaBus Ticketing System in Java Assignment
Bus ticketing system in Java, built from the assignment spec. 4 classes, seat grid, invoices, ban set, plus 3 bugs that erase saved data.
Jul 28, 2026
-
 Programming Homework Tips
How to Break Down a Programming Assignment
Learn how to turn a programming assignment brief into a clear plan using requirements, pseudocode, testing, and a C salary-raise example.
Jul 21, 2026